4.3 Double-Slit Diffraction
Learning Objectives
By the end of this section, you will be able to:
- Describe the combined effect of interference and diffraction with two slits, each with finite width
- Determine the relative intensities of interference fringes within a diffraction pattern
- Identify missing orders, if any
When we studied interference in Young’s double-slit experiment, we ignored the diffraction effect in each slit. We assumed that the slits were so narrow that on the screen you saw only the interference of light from just two point sources. If the slit is smaller than the wavelength, then Figure 4.10(a) shows that there is just a spreading of light and no peaks or troughs on the screen. Therefore, it was reasonable to leave out the diffraction effect in that chapter. However, if you make the slit wider, Figure 4.10(b) and (c) show that you cannot ignore diffraction. In this section, we study the complications to the double-slit experiment that arise when you also need to take into account the diffraction effect of each slit.
To calculate the diffraction pattern for two (or any number of) slits, we need to generalize the method we just used for a single slit. That is, across each slit, we place a uniform distribution of point sources that radiate Huygens wavelets, and then we sum the wavelets from all the slits. This gives the intensity at any point on the screen. Although the details of that calculation can be complicated, the final result is quite simple:
Two-Slit Diffraction Pattern
The diffraction pattern of two slits of width a that are separated by a distance d is the interference pattern of two point sources separated by d multiplied by the diffraction pattern of a slit of width a.
In other words, the locations of the interference fringes are given by the equation , the same as when we considered the slits to be point sources, but the intensities of the fringes are now reduced by diffraction effects, according to Equation 4.4. [Note that in the chapter on interference, we wrote and used the integer m to refer to interference fringes. Equation 4.1 also uses m, but this time to refer to diffraction minima. If both equations are used simultaneously, it is good practice to use a different variable (such as n) for one of these integers in order to keep them distinct.]
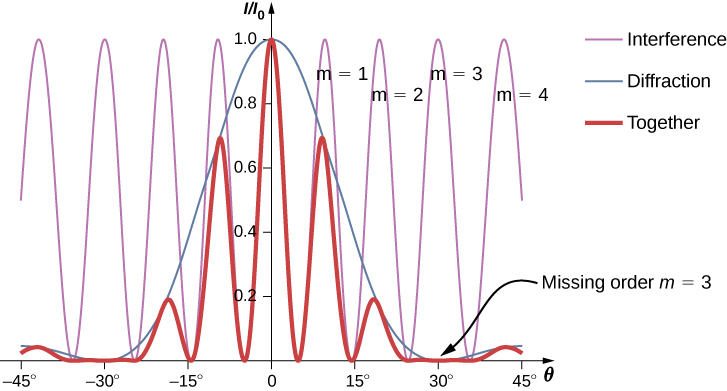
Interference and diffraction effects operate simultaneously and generally produce minima at different angles. This gives rise to a complicated pattern on the screen, in which some of the maxima of interference from the two slits are missing if the maximum of the interference is in the same direction as the minimum of the diffraction. We refer to such a missing peak as a missing order. One example of a diffraction pattern on the screen is shown in Figure 4.11. The solid line with multiple peaks of various heights is the intensity observed on the screen. It is a product of the interference pattern of waves from separate slits and the diffraction of waves from within one slit.
Example 4.3
Intensity of the Fringes
Figure 4.11 shows that the intensity of the fringe for is zero, but what about the other fringes? Calculate the intensity for the fringe at relative to the intensity of the central peak.Strategy
Determine the angle for the double-slit interference fringe, using the equation from Interference, then determine the relative intensity in that direction due to diffraction by using Equation 4.4.Solution
From the chapter on interference, we know that the bright interference fringes occur at , orFrom Equation 4.4,
Substituting from above,
For , , and ,
Then, the intensity is
Significance
Note that this approach is relatively straightforward and gives a result that is almost exactly the same as the more complicated analysis using phasors to work out the intensity values of the double-slit interference (thin line in Figure 4.11). The phasor approach accounts for the downward slope in the diffraction intensity (blue line) so that the peak near occurs at a value of ever so slightly smaller than we have shown here.Example 4.4
Two-Slit Diffraction
Suppose that in Young’s experiment, slits of width 0.020 mm are separated by 0.20 mm. If the slits are illuminated by monochromatic light of wavelength 500 nm, how many bright fringes are observed in the central peak of the diffraction pattern?Solution
From Equation 4.1, the angular position of the first diffraction minimum isUsing for , we find
which is the maximum interference order that fits inside the central peak. We note that are missing orders as matches exactly. Accordingly, we observe bright fringes for
for a total of 19 bright fringes.
Check Your Understanding 4.3
For the experiment in Example 4.4, show that is also a missing order.
Interactive
Explore the effects of double-slit diffraction. In this simulation written by Fu-Kwun Hwang, select using the slider and see what happens when you control the slit width, slit separation and the wavelength. Can you make an order go “missing?”