8.5 Atomic Spectra and X-rays
Learning Objectives
By the end of this section, you will be able to:
- Describe the absorption and emission of radiation in terms of atomic energy levels and energy differences
- Use quantum numbers to estimate the energy, frequency, and wavelength of photons produced by atomic transitions in multi-electron atoms
- Explain radiation concepts in the context of atomic fluorescence and X-rays
The study of atomic spectra provides most of our knowledge about atoms. In modern science, atomic spectra are used to identify species of atoms in a range of objects, from distant galaxies to blood samples at a crime scene.
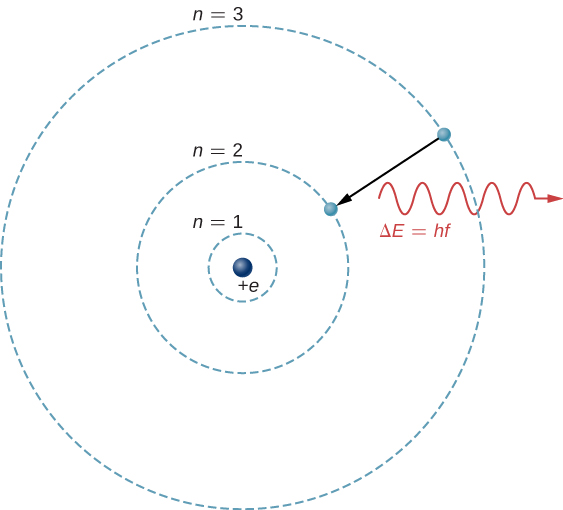
The theoretical basis of atomic spectroscopy is the transition of electrons between energy levels in atoms. For example, if an electron in a hydrogen atom makes a transition from the to the shell, the atom emits a photon with a wavelength
where is energy carried away by the photon and . After this radiation passes through a spectrometer, it appears as a sharp spectral line on a screen. The Bohr model of this process is shown in Figure 8.18. If the electron later absorbs a photon with energy , the electron returns to the shell. (We examined the Bohr model earlier, in Photons and Matter Waves.)
To understand atomic transitions in multi-electron atoms, it is necessary to consider many effects, including the Coulomb repulsion between electrons and internal magnetic interactions (spin-orbit and spin-spin couplings). Fortunately, many properties of these systems can be understood by neglecting interactions between electrons and representing each electron by its own single-particle wave function .
Atomic transitions must obey selection rules. These rules follow from principles of quantum mechanics and symmetry. Selection rules classify transitions as either allowed or forbidden. (Forbidden transitions do occur, but the probability of the typical forbidden transition is very small.) For a hydrogen-like atom, atomic transitions that involve electromagnetic interactions (the emission and absorption of photons) obey the following selection rule:
where l is associated with the magnitude of orbital angular momentum,
For multi-electron atoms, similar rules apply. To illustrate this rule, consider the observed atomic transitions in hydrogen (H), sodium (Na), and mercury (Hg) (Figure 8.19). The horizontal lines in this diagram correspond to atomic energy levels, and the transitions allowed by this selection rule are shown by lines drawn between these levels. The energies of these states are on the order of a few electron volts, and photons emitted in transitions are in the visible range. Technically, atomic transitions can violate the selection rule, but such transitions are uncommon.
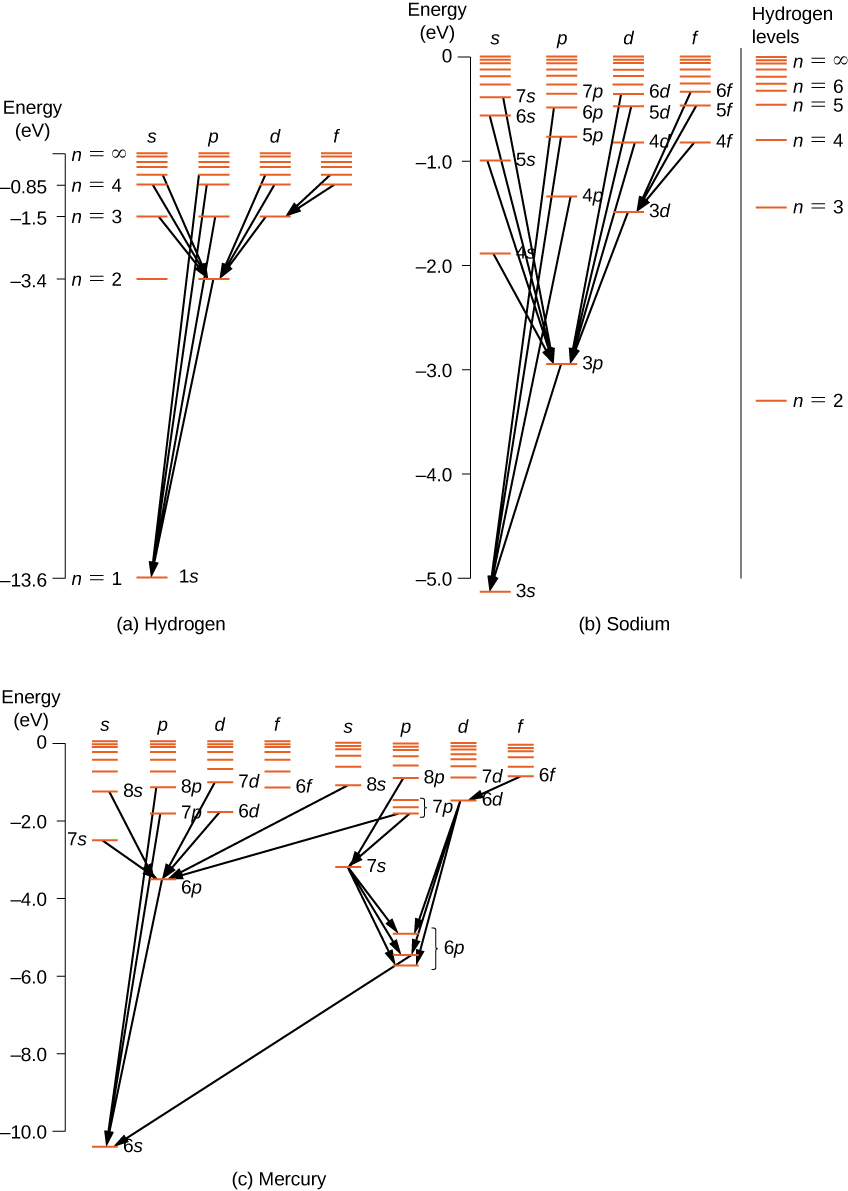
The hydrogen atom has the simplest energy-level diagram. If we neglect electron spin, all states with the same value of n have the same total energy. However, spin-orbit coupling splits the states into two angular momentum states (s and p) of slightly different energies. (These levels are not vertically displaced, because the energy splitting is too small to show up in this diagram.) Likewise, spin-orbit coupling splits the states into three angular momentum states (s, p, and d).
The energy-level diagram for hydrogen is similar to sodium, because both atoms have one electron in the outer shell. The valence electron of sodium moves in the electric field of a nucleus shielded by electrons in the inner shells, so it does not experience a simple 1/r Coulomb potential and its total energy depends on both n and l. Interestingly, mercury has two separate energy-level diagrams; these diagrams correspond to two net spin states of its 6s (valence) electrons.
Example 8.6
The Sodium Doublet
The spectrum of sodium is analyzed with a spectrometer. Two closely spaced lines with wavelengths 589.00 nm and 589.59 nm are observed. (a) If the doublet corresponds to the excited (valence) electron that transitions from some excited state down to the 3s state, what was the original electron angular momentum? (b) What is the energy difference between these two excited states?Strategy
Sodium and hydrogen belong to the same column or chemical group of the periodic table, so sodium is “hydrogen-like.” The outermost electron in sodium is in the 3s () subshell and can be excited to higher energy levels. As for hydrogen, subsequent transitions to lower energy levels must obey the selection rule:We must first determine the quantum number of the initial state that satisfies the selection rule. Then, we can use this number to determine the magnitude of orbital angular momentum of the initial state.
Solution
- Allowed transitions must obey the selection rule. If the quantum number of the initial state is , the transition is forbidden because . If the quantum number of the initial state is ,…the transition is forbidden because Therefore, the quantum of the initial state must be . The orbital angular momentum of the initial state is
- Because the final state for both transitions is the same (3s), the difference in energies of the photons is equal to the difference in energies of the two excited states. Using the equation we have
Significance
To understand the difficulty of measuring this energy difference, we compare this difference with the average energy of the two photons emitted in the transition. Given an average wavelength of 589.30 nm, the average energy of the photons isThe energy difference is about 0.1% (1 part in 1000) of this average energy. However, a sensitive spectrometer can measure the difference.
Atomic Fluorescence
Fluorescence occurs when an electron in an atom is excited several steps above the ground state by the absorption of a high-energy ultraviolet (UV) photon. Once excited, the electron “de-excites” in two ways. The electron can drop back to the ground state, emitting a photon of the same energy that excited it, or it can drop in a series of smaller steps, emitting several low-energy photons. Some of these photons may be in the visible range. Fluorescent dye in clothes can make colors seem brighter in sunlight by converting UV radiation into visible light. Fluorescent lights are more efficient in converting electrical energy into visible light than incandescent filaments (about four times as efficient). Figure 8.20 shows a scorpion illuminated by a UV lamp. Proteins near the surface of the skin emit a characteristic blue light.

X-rays
The study of atomic energy transitions enables us to understand X-rays and X-ray technology. Like all electromagnetic radiation, X-rays are made of photons. X-ray photons are produced when electrons in the outermost shells of an atom drop to the inner shells. (Hydrogen atoms do not emit X-rays, because the electron energy levels are too closely spaced together to permit the emission of high-frequency radiation.) Transitions of this kind are normally forbidden because the lower states are already filled. However, if an inner shell has a vacancy (an inner electron is missing, perhaps from being knocked away by a high-speed electron), an electron from one of the outer shells can drop in energy to fill the vacancy. The energy gap for such a transition is relatively large, so wavelength of the radiated X-ray photon is relatively short.
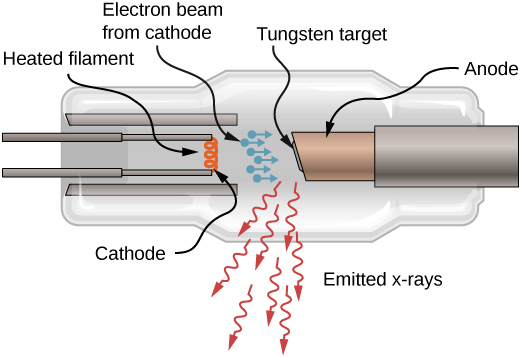
X-rays can also be produced by bombarding a metal target with high-energy electrons, as shown in Figure 8.21. In the figure, electrons are boiled off a filament and accelerated by an electric field into a tungsten target. According to the classical theory of electromagnetism, any charged particle that accelerates emits radiation. Thus, when the electron strikes the tungsten target, and suddenly slows down, the electron emits braking radiation. (Braking radiation refers to radiation produced by any charged particle that is slowed by a medium.) In this case, braking radiation contains a continuous range of frequencies, because the electrons will collide with the target atoms in slightly different ways.
Braking radiation is not the only type of radiation produced in this interaction. In some cases, an electron collides with another inner-shell electron of a target atom, and knocks the electron out of the atom—billiard ball style. The empty state is filled when an electron in a higher shell drops into the state (drop in energy level) and emits an X-ray photon.
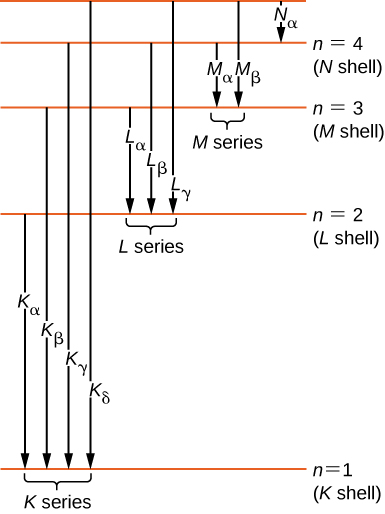
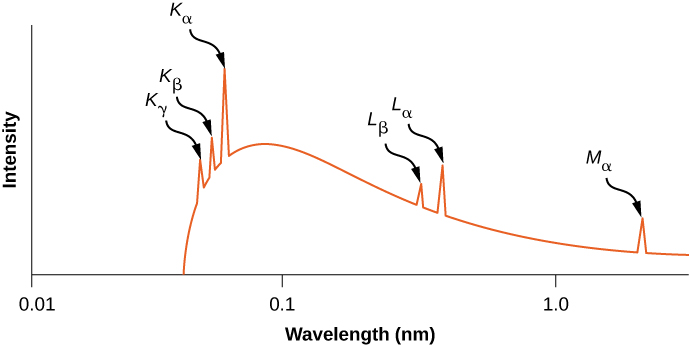
Historically, X-ray spectral lines were labeled with letters (K, L, M, N, …). These letters correspond to the atomic shells (). X-rays produced by a transition from any higher shell to the K () shell are labeled as K X-rays. X-rays produced in a transition from the L () shell are called X-rays; X-rays produced in a transition from the M () shell are called X-rays; X-rays produced in a transition from the N () shell are called X-rays; and so forth. Transitions from higher shells to L and M shells are labeled similarly. These transitions are represented by an energy-level diagram in Figure 8.22.
The distribution of X-ray wavelengths produced by striking metal with a beam of electrons is given in Figure 8.23. X-ray transitions in the target metal appear as peaks on top of the braking radiation curve. Photon frequencies corresponding to the spikes in the X-ray distribution are called characteristic frequencies, because they can be used to identify the target metal. The sharp cutoff wavelength (just below the peak) corresponds to an electron that loses all of its energy to a single photon. Radiation of shorter wavelengths is forbidden by the conservation of energy.
Example 8.7
X-Rays from Aluminum
Estimate the characteristic energy and frequency of the X-ray for aluminum ().Strategy
A X-ray is produced by the transition of an electron in the L () shell to the K () shell. An electron in the L shell “sees” a charge because one electron in the K shell shields the nuclear charge. (Recall, two electrons are not in the K shell because the other electron state is vacant.) The frequency of the emitted photon can be estimated from the energy difference between the L and K shells.Solution
The energy difference between the L and K shells in a hydrogen atom is 10.2 eV. Assuming that other electrons in the L shell or in higher-energy shells do not shield the nuclear charge, the energy difference between the L and K shells in an atom with is approximatelyBased on the relationship , the frequency of the X-ray is
Significance
The wavelength of the typical X-ray is 0.1–10 nm. In this case, the wavelength is:Hence, the transition LK in aluminum produces X-ray radiation.
X-ray production provides an important test of quantum mechanics. According to the Bohr model, the energy of a X-ray depends on the nuclear charge or atomic number, Z. If Z is large, Coulomb forces in the atom are large, energy differences () are large, and, therefore, the energy of radiated photons is large. To illustrate, consider a single electron in a multi-electron atom. Neglecting interactions between the electrons, the allowed energy levels are
where n = 1, 2, …and Z is the atomic number of the nucleus. However, an electron in the L () shell “sees” a charge , because one electron in the K shell shields the nuclear charge. (Recall that there is only one electron in the K shell because the other electron was “knocked out.”) Therefore, the approximate energies of the electron in the L and K shells are
The energy carried away by a photon in a transition from the L shell to the K shell is therefore
where Z is the atomic number. In general, the X-ray photon energy for a transition from an outer shell to the K shell is
or
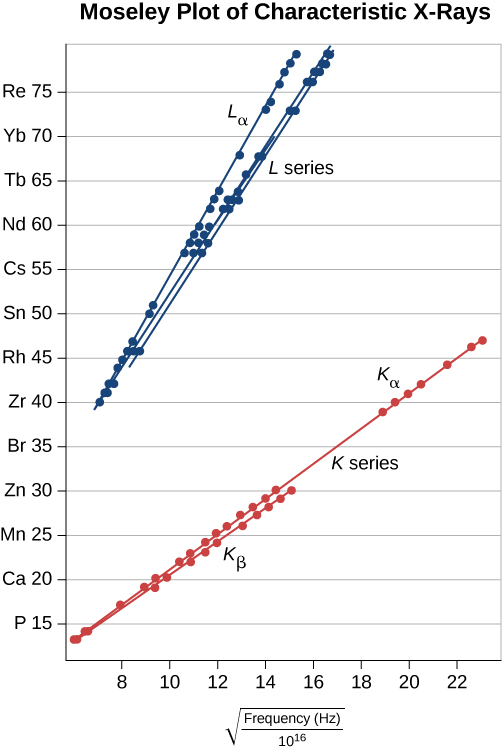
where f is the frequency of a X-ray. This equation is Moseley’s law. For large values of Z, we have approximately
This prediction can be checked by measuring f for a variety of metal targets. This model is supported if a plot of Z versus data (called a Moseley plot) is linear. Comparison of model predictions and experimental results, for both the K and L series, is shown in Figure 8.24. The data support the model that X-rays are produced when an outer shell electron drops in energy to fill a vacancy in an inner shell.
Check Your Understanding 8.3
X-rays are produced by bombarding a metal target with high-energy electrons. If the target is replaced by another with two times the atomic number, what happens to the frequency of X-rays?
Example 8.8
Characteristic X-Ray Energy
Calculate the approximate energy of a X-ray from a tungsten anode in an X-ray tube.Strategy
Two electrons occupy a filled K shell. A vacancy in this shell would leave one electron, so the effective charge for an electron in the L shell would be Z − 1 rather than Z. For tungsten, so the effective charge is 73. This number can be used to calculate the energy-level difference between the L and K shells, and, therefore, the energy carried away by a photon in the transitionSolution
The effective Z is 73, so the X-ray energy is given bywhere
and
Thus,
Significance
This large photon energy is typical of X-rays. X-ray energies become progressively larger for heavier elements because their energy increases approximately as . An acceleration voltage of more than 50,000 volts is needed to “knock out” an inner electron from a tungsten atom.X-ray Technology
X-rays have many applications, such as in medical diagnostics (Figure 8.25), inspection of luggage at airports (Figure 8.26), and even detection of cracks in crucial aircraft components. The most common X-ray images are due to shadows. Because X-ray photons have high energy, they penetrate materials that are opaque to visible light. The more energy an X-ray photon has, the more material it penetrates. The depth of penetration is related to the density of the material, as well as to the energy of the photon. The denser the material, the fewer X-ray photons get through and the darker the shadow. X-rays are effective at identifying bone breaks and tumors; however, overexposure to X-rays can damage cells in biological organisms.


A standard X-ray image provides a two-dimensional view of the object. However, in medical applications, this view does not often provide enough information to draw firm conclusions. For example, in a two-dimensional X-ray image of the body, bones can easily hide soft tissues or organs. The CAT (computed axial tomography) scanner addresses this problem by collecting numerous X-ray images in “slices” throughout the body. Complex computer-image processing of the relative absorption of the X-rays, in different directions, can produce a highly detailed three-dimensional X-ray image of the body.
X-rays can also be used to probe the structures of atoms and molecules. Consider X-rays incident on the surface of a crystalline solid. Some X-ray photons reflect at the surface, and others reflect off the “plane” of atoms just below the surface. Interference between these photons, for different angles of incidence, produces a beautiful image on a screen (Figure 8.27). The interaction of X-rays with a solid is called X-ray diffraction. The most famous example using X-ray diffraction is the discovery of the double-helix structure of DNA.